
Kelsey Rydland - Data Science Librarian
Méch Frazier - Geospatial Specialist
Geospatial and Data Services - Northwestern University Libraries
We’ll be using ArcPro and ArcOnline for today’s demo. You’ll need to create an ArcGIS Online account here. To download and install ArcPro, go here.
ArcOnline is compatiable with Mac and Windows OS; ArcPro is only compatiable with Windows OS
Want to follow along the demo? Download Data

This workshop is meant to serve as an introduction to bivariate choropleth mapping. It’s a simple workshop that you should be able to replicate on your own afterwards.
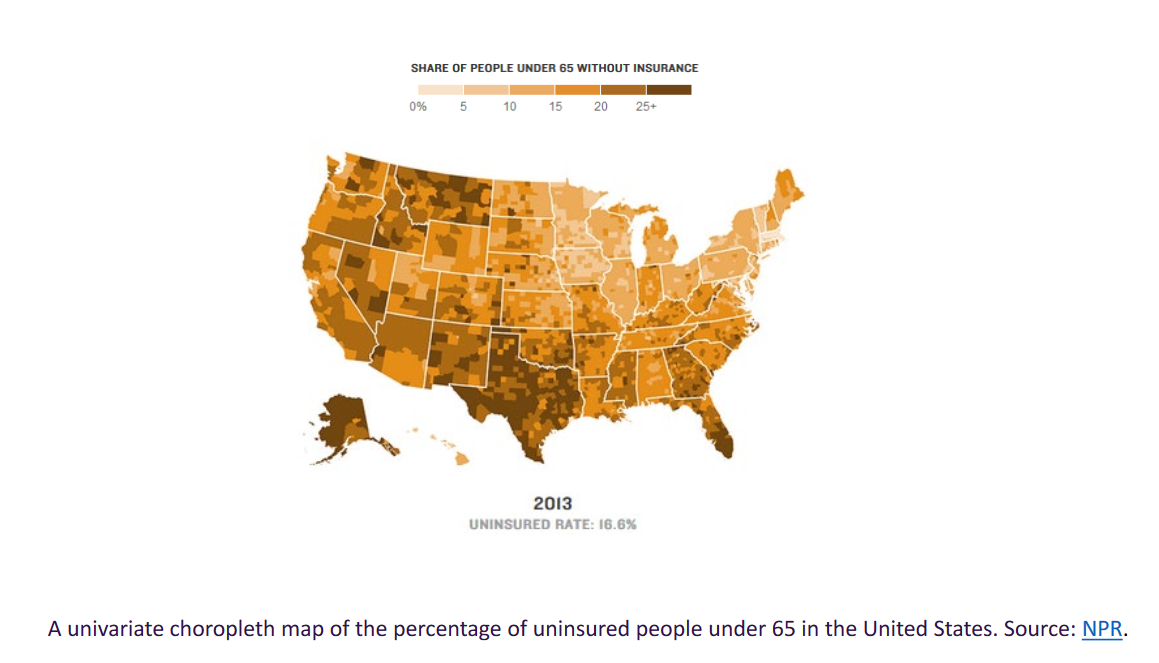
Distinguish between univariate and bivariate
Use resources from ArcGIS Online public layer sources
Knowledge of basic symbology functions
Ability to make a bivariate choropleth map and layout
Resources and support opportunities


Normalize your data (!)
Use variables you suspect have a relationship (e.g., rainfall & diabetes vs. obesity & diabetes)
Not statistically significant, only looking at highest vs. lowest values of overlaid variables
CDC U.S. Diabetes Surveillance System
- Adults Aged 20+ Years; Age-Adjusted Percentage; U.S. Counties; 2016
- Join fields “GEOID” from US.shp and “CountyFIPS” from Sheet1$
- Copy and paste: Obesity and Diabetes Measures 2016 CDC